- Developed configuration-driven workflows for plotting and comparing multiple pump curves
- Implemented parallel and series pump combination logic for both similar and dissimilar pump configurations
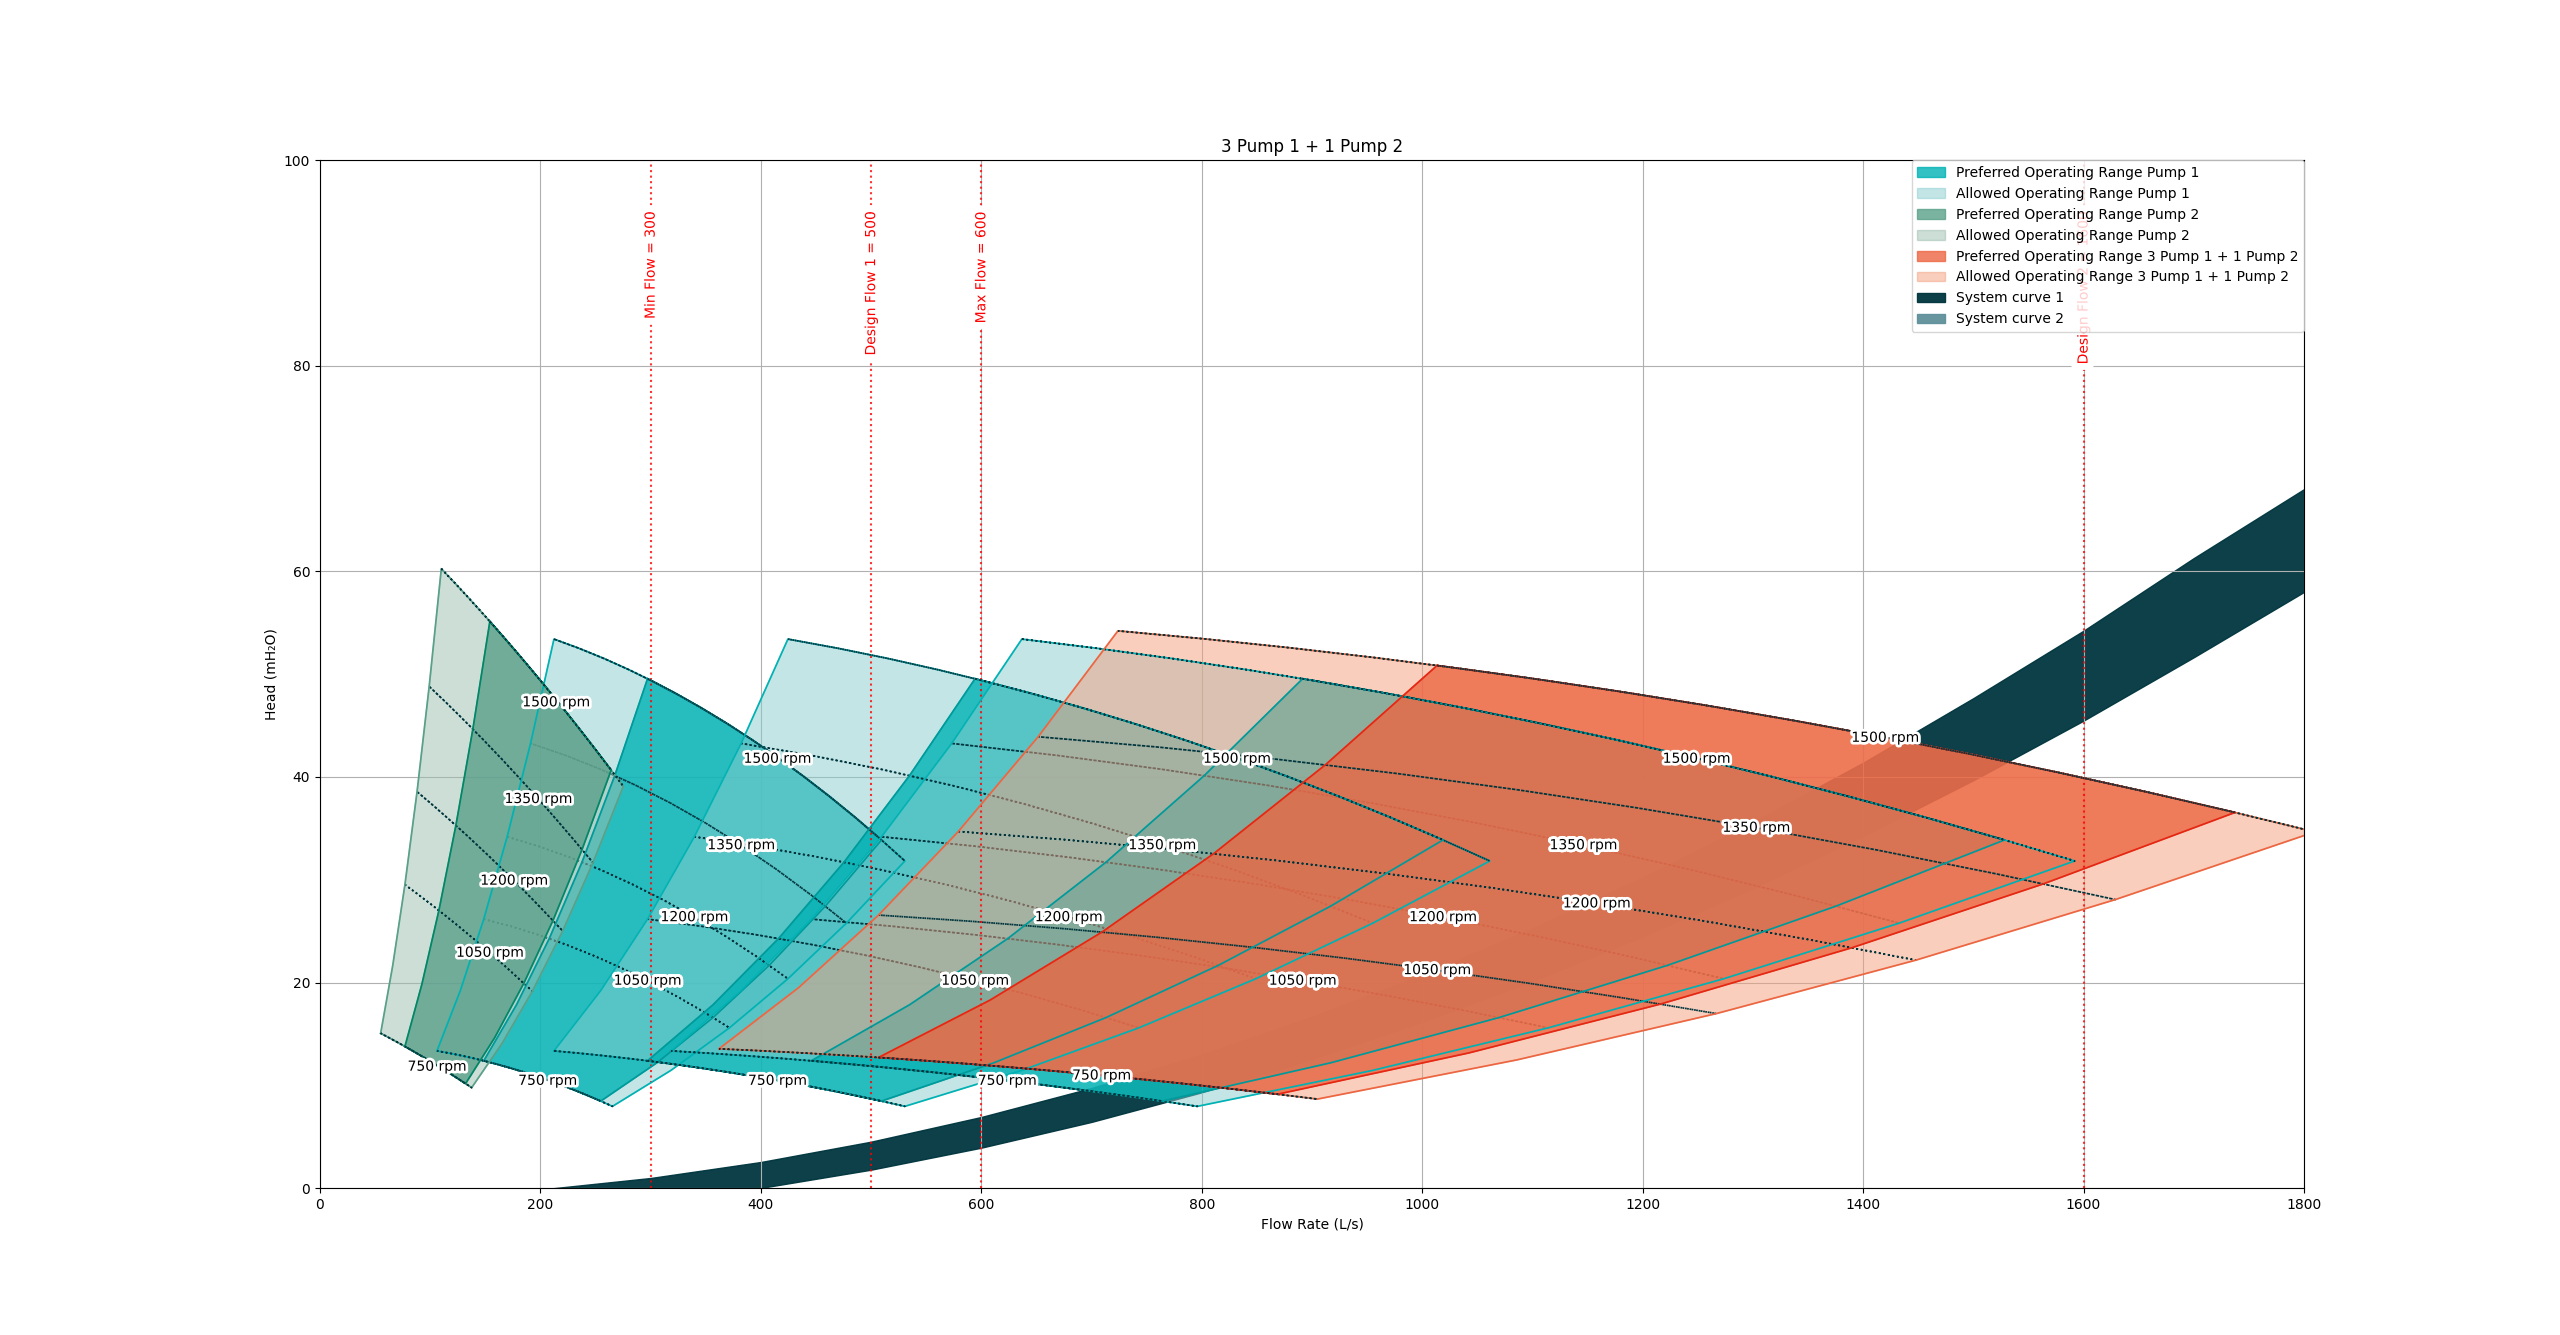
- Added automatic handling of Preferred Operating Range (POR) and Allowable Operating Range (AOR)
- Integrated physically realistic system curves and annotated duty points
- Designed robust data cleaning and interpolation routines to handle real-world pump data inconsistencies
Project Overview
This project is a Python-based engineering visualisation and analysis tool developed to assess centrifugal pump performance under a range of operating conditions.
The tool supports system curve overlays, operating envelopes, and pump combinations in both parallel and series arrangements, allowing rapid evaluation of pump station behaviour across multiple demand scenarios.
While originally developed for water infrastructure applications, the underlying approach is broadly applicable to any system involving coupled pump-system interactions.
What I Did
Key Engineering Concepts
Source Code
The supporting source code for this project is available on GitHub:
github.com/flynndevoy/pump-plot
The repository contains configuration files, data handling logic, and
pump combination routines. The core plotting backend
(pump_plot.py) was not developed by me and is therefore not
included in the public repository.
Notes on Data & Attribution
All pump curves and system curves shown here are synthetic and used solely for demonstration and development purposes.
My contribution focuses on data preparation, pump combination logic, configuration, and system-level interpretation rather than the underlying plotting engine.